
Connecting Natural Environmental Influences Through Technology and Art
WeatherWand is an innovative mobile weather station in the form of a compact wand that measures real environmental conditions and transforms them into unique generative art visualizations. The project bridges the gap between physical sensor data and creative digital representation, making weather data both accessible and visually engaging.
The Concept
Weather data is all around us, but traditional weather apps present it in sterile, numerical formats. WeatherWand takes a different approach by creating a personal, tangible weather measurement device that generates unique artistic visualizations based on the environmental conditions you actually experience.
The system consists of:
- Physical weather wand with embedded sensors
- Progressive Web App for data visualization
- Generative art engine creating unique visual representations
- Integration with national weather services for forecasts and warnings
Technical Implementation
Hardware Components
The WeatherWand device includes:
- ESP32 microcontroller: Core processing and connectivity
- DS18B20 temperature sensor: Accurate environmental temperature readings
- Bluetooth Low Energy (BLE): Wireless data transmission to mobile devices
- MQTT protocol: Efficient sensor data communication
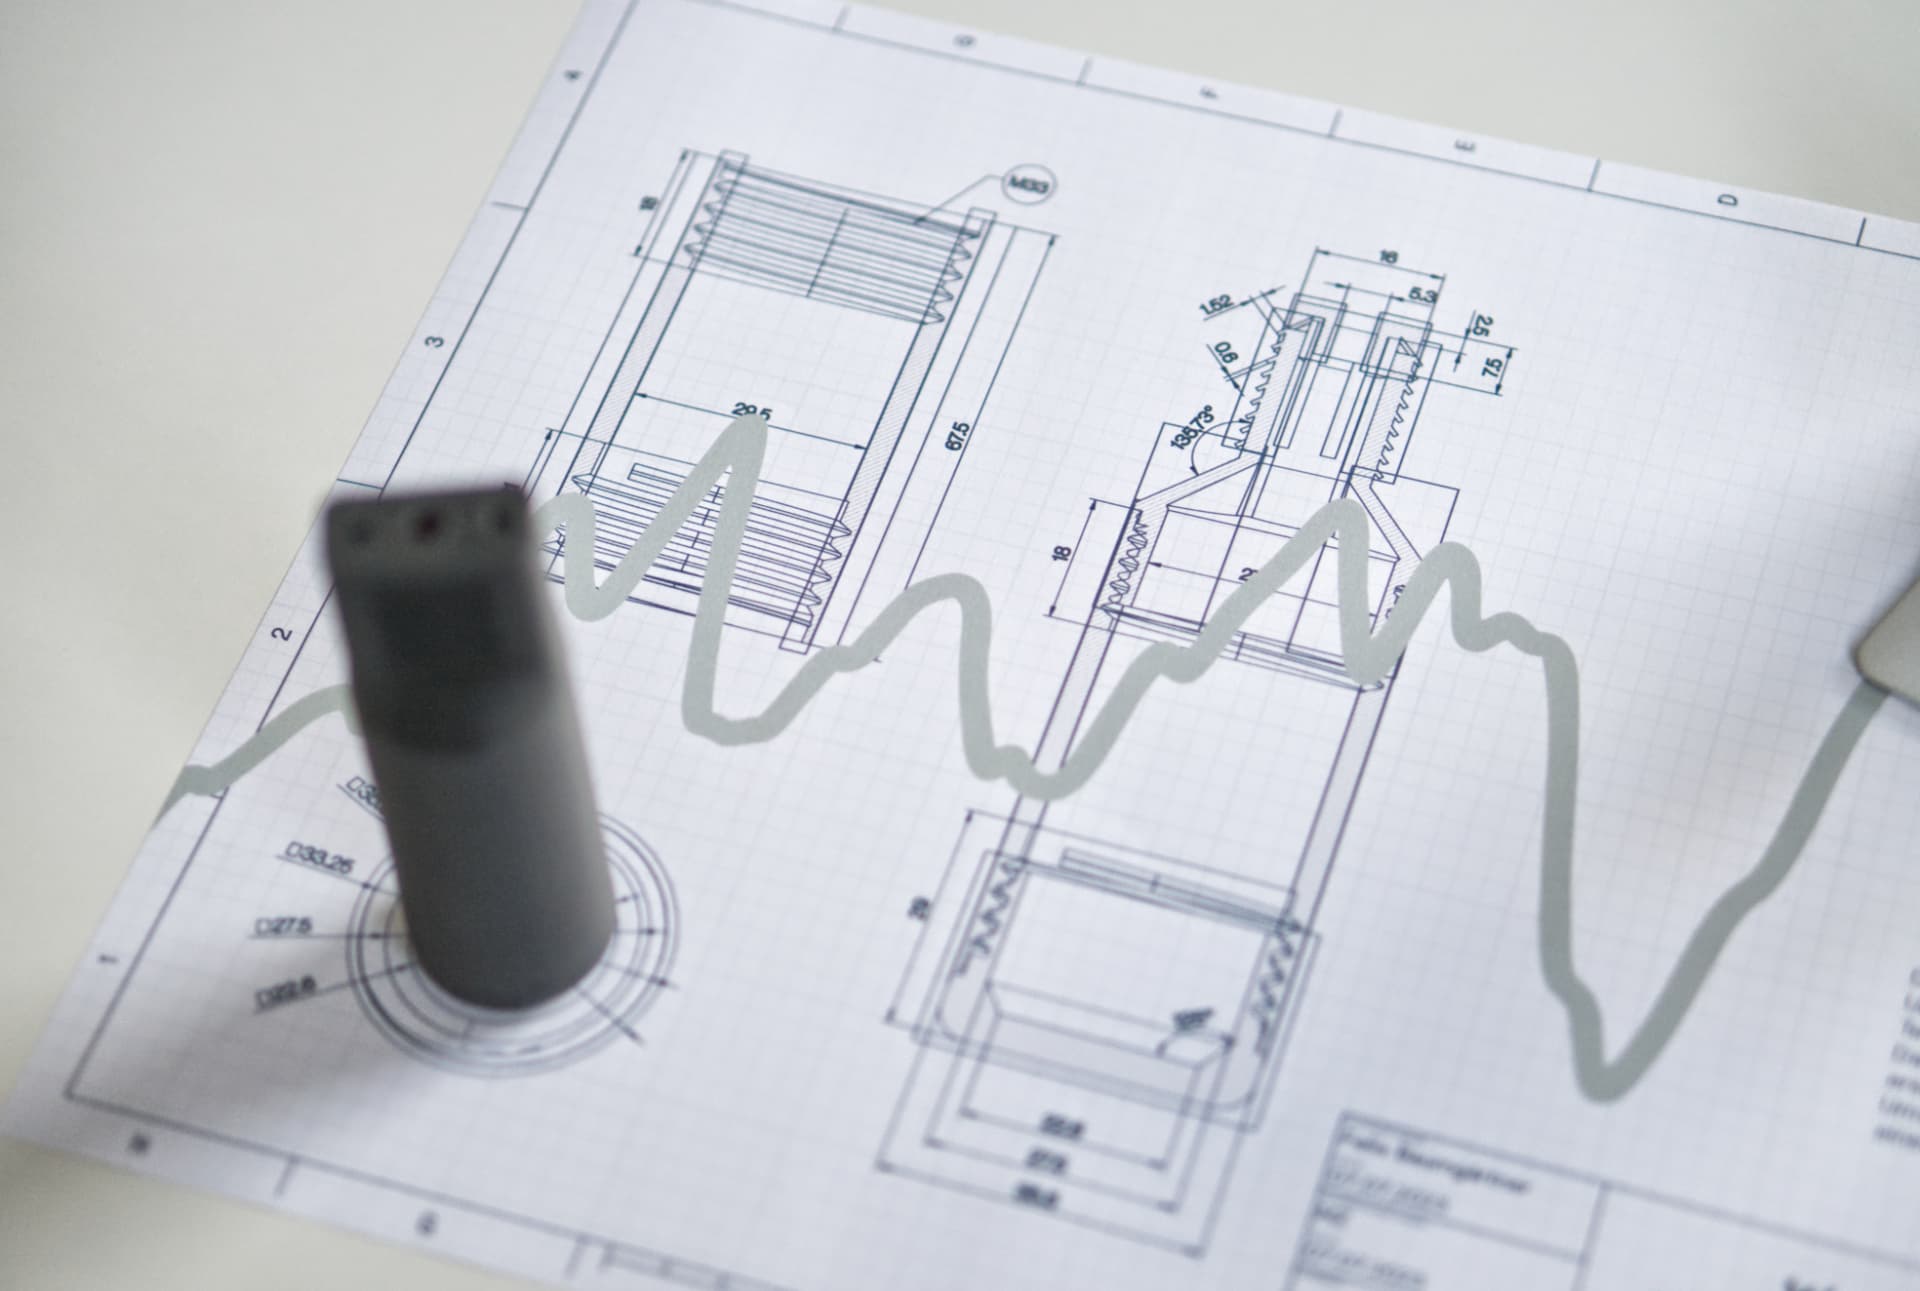
- Custom wand enclosure: Portable, weather-resistant design
Software Architecture
Progressive Web App (PWA):
- Built with modern web technologies for cross-platform compatibility
- Capacitor framework enables compilation to native Android app
- Web Bluetooth API for direct hardware communication (Chrome required)
- Responsive design works on smartphones, tablets and desktops
Data Sources:
- Real-time sensor readings from physical device
- DWD Open Data integration (German Weather Service):
- 16-day weather forecasts
- Meteograms
- Radar imagery
- Weather warnings and alerts
Generative Visualizations:
- Custom algorithms transform weather data into unique visual art
- Temperature, humidity and atmospheric conditions influence artistic output
- Each weather condition generates distinctive visual patterns
- Real-time updates as environmental conditions change
Development Stages
Ideation and Research
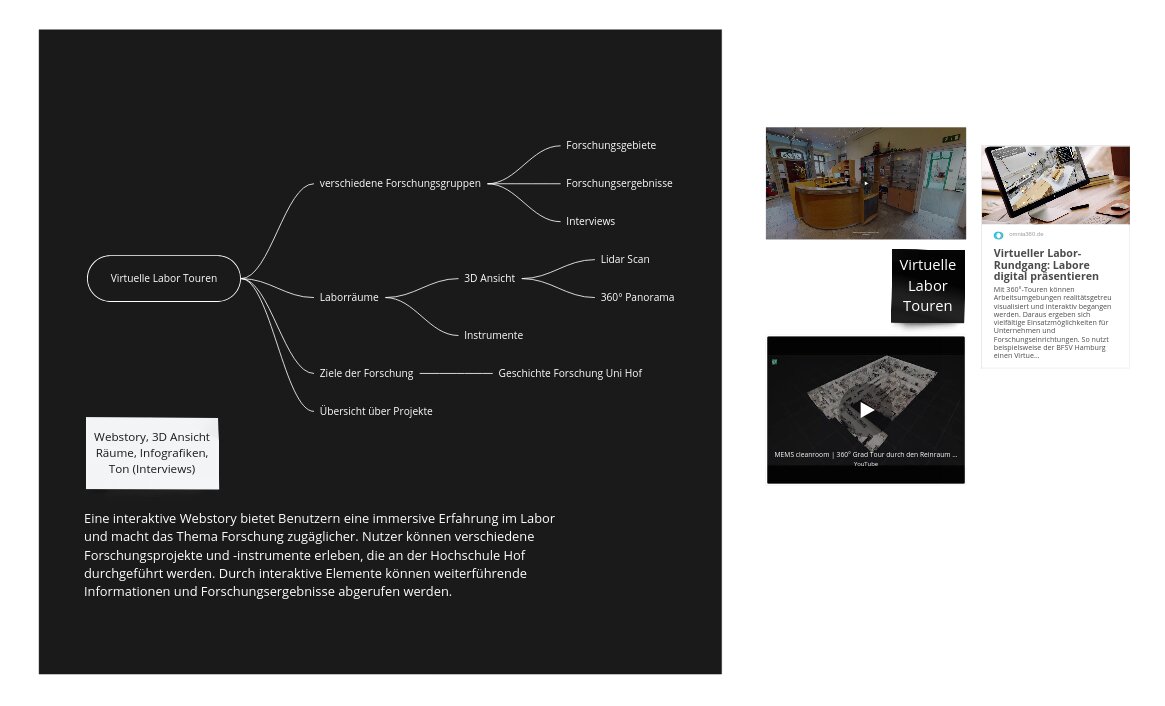 Exploring different interaction concepts for weather visualization
 Refining the weather wand concept
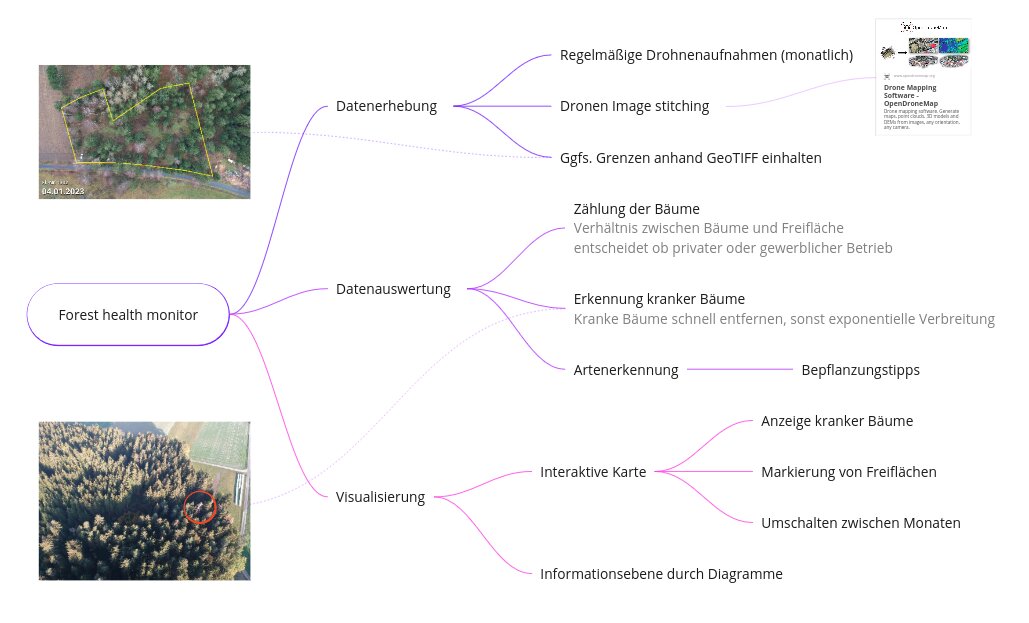
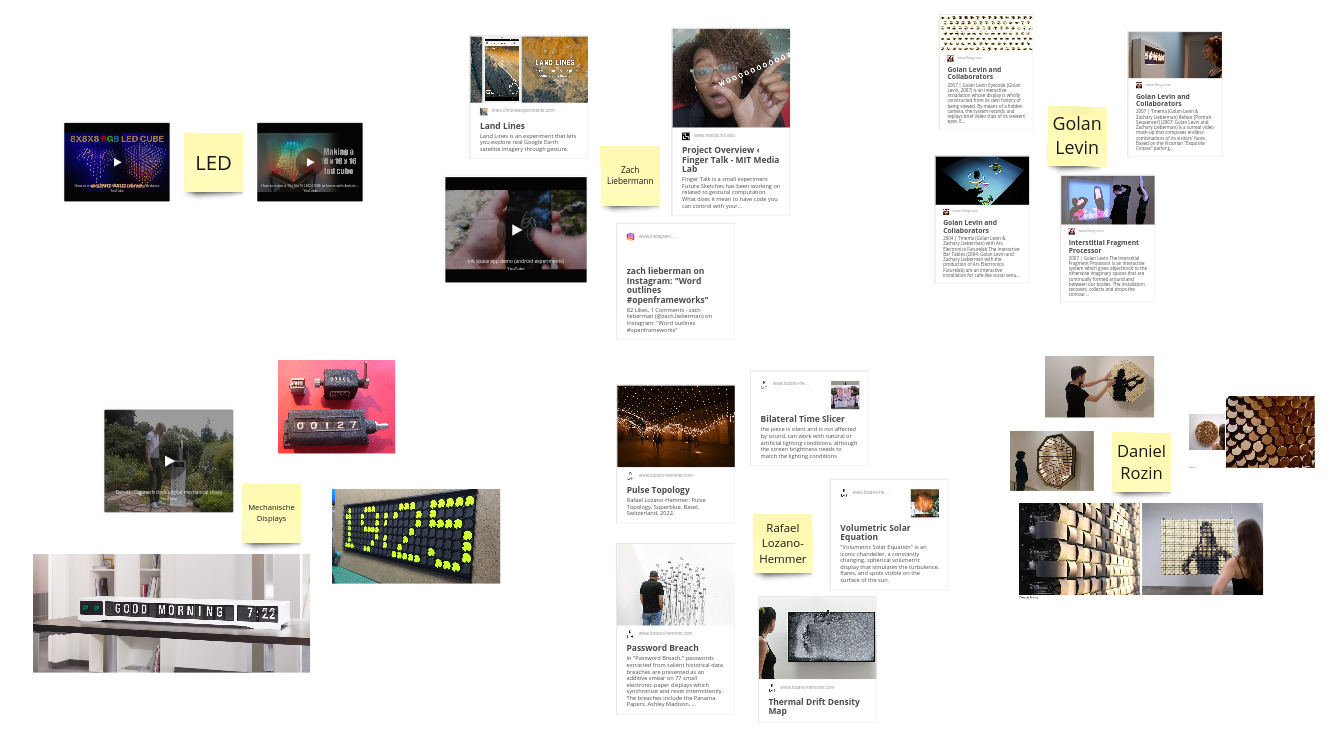 Research into existing weather visualization and IoT projects
Prototyping and Development
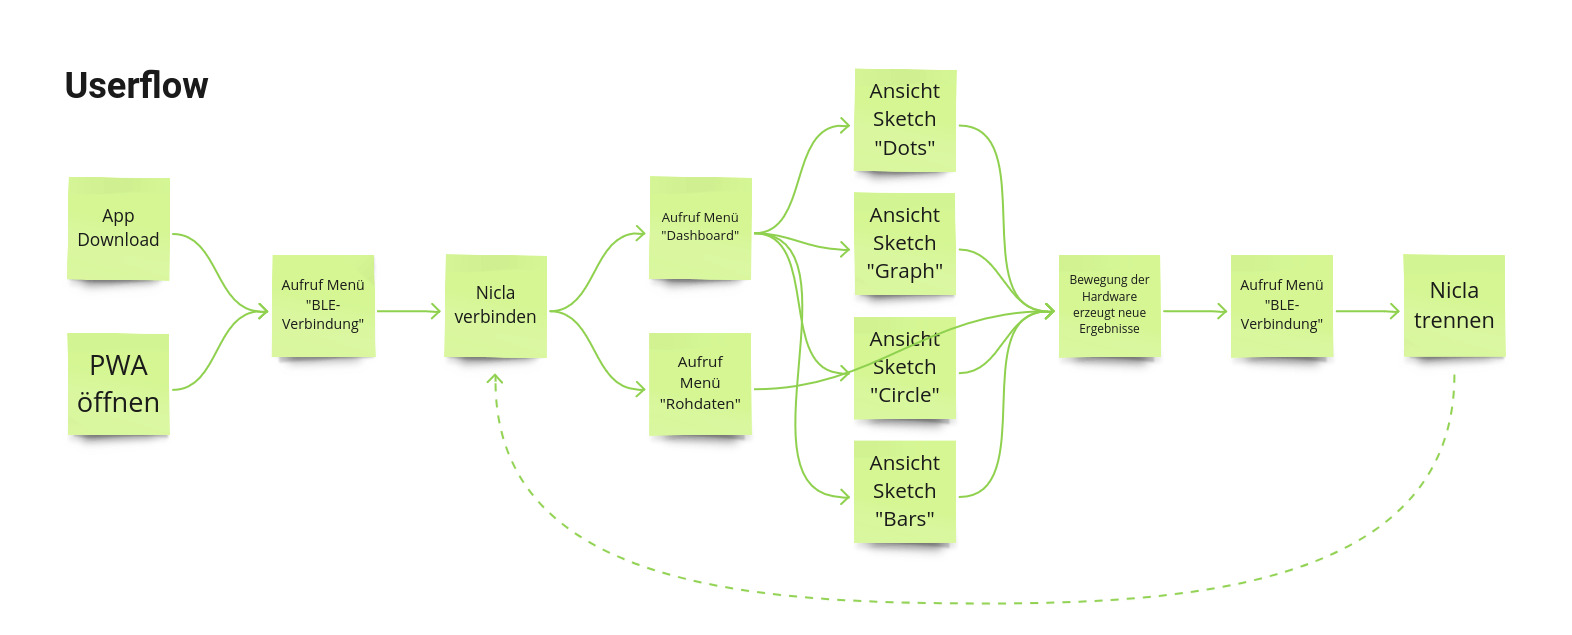 Mapping the user journey from device pairing to data visualization
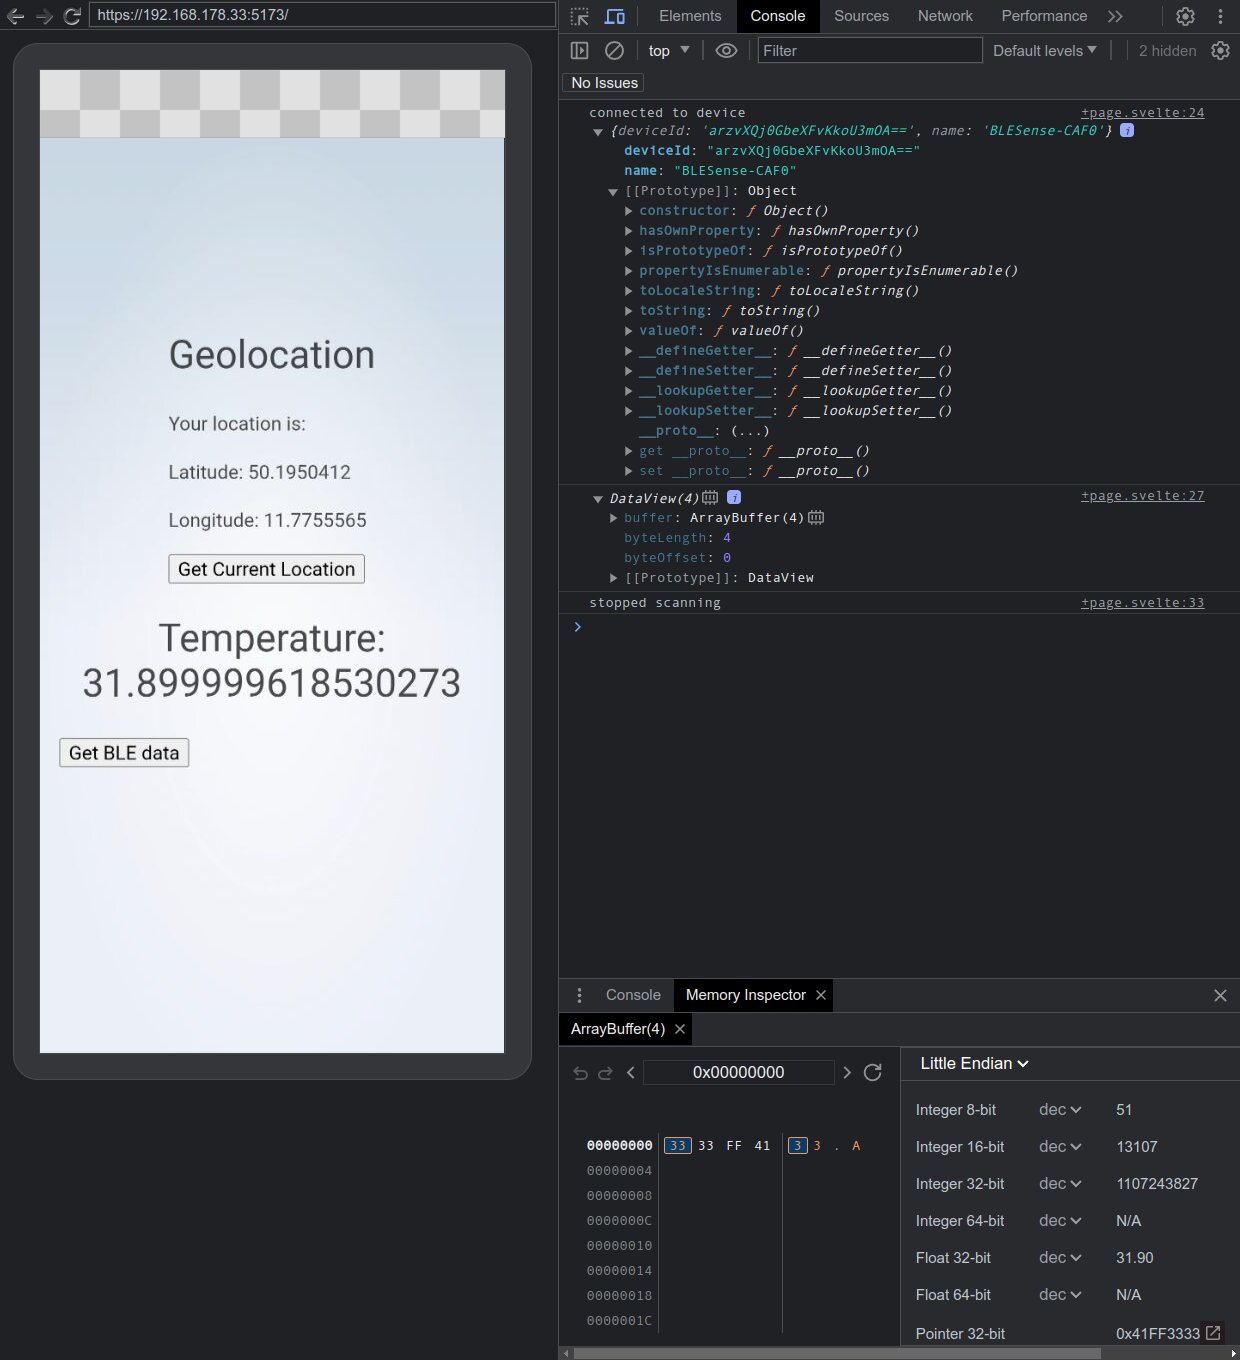 Implementing Bluetooth Low Energy connectivity between hardware and app
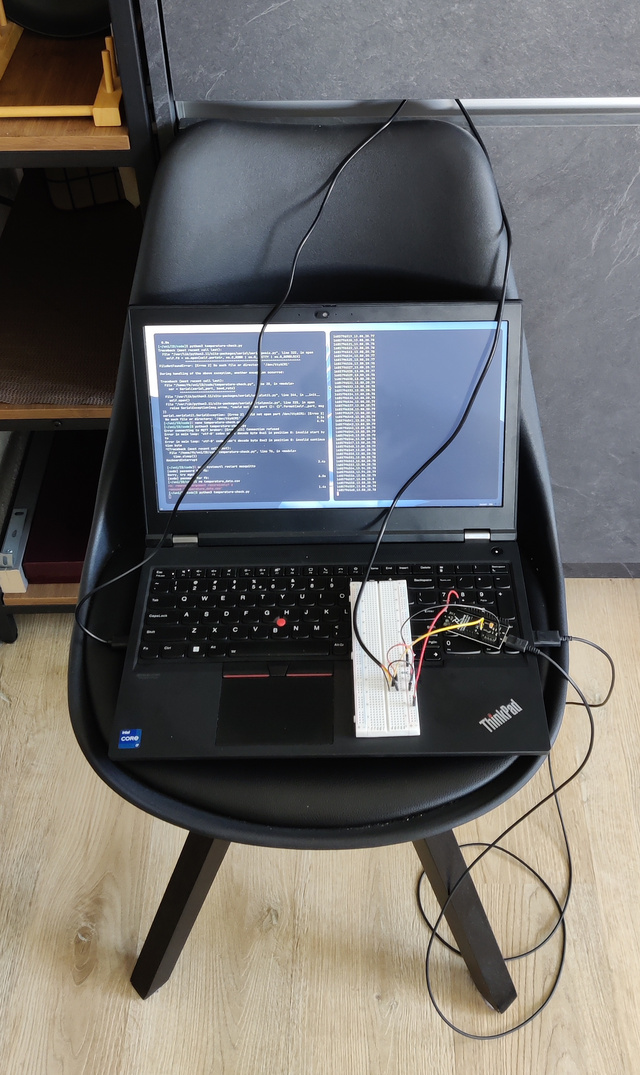 Hardware testing environment with ESP32 and sensors
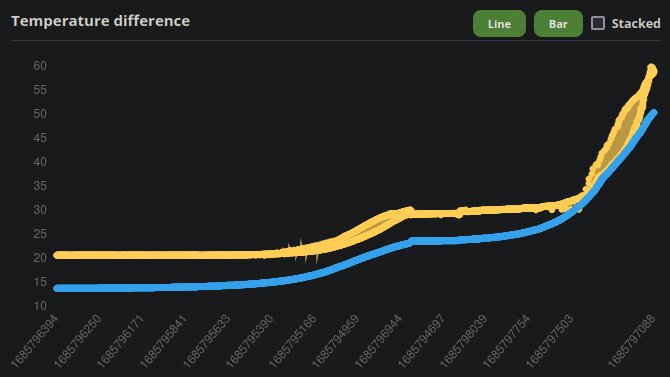 Testing generative visualizations based on temperature changes
Exhibition and Final Presentation
 Exhibition setup at university showcase
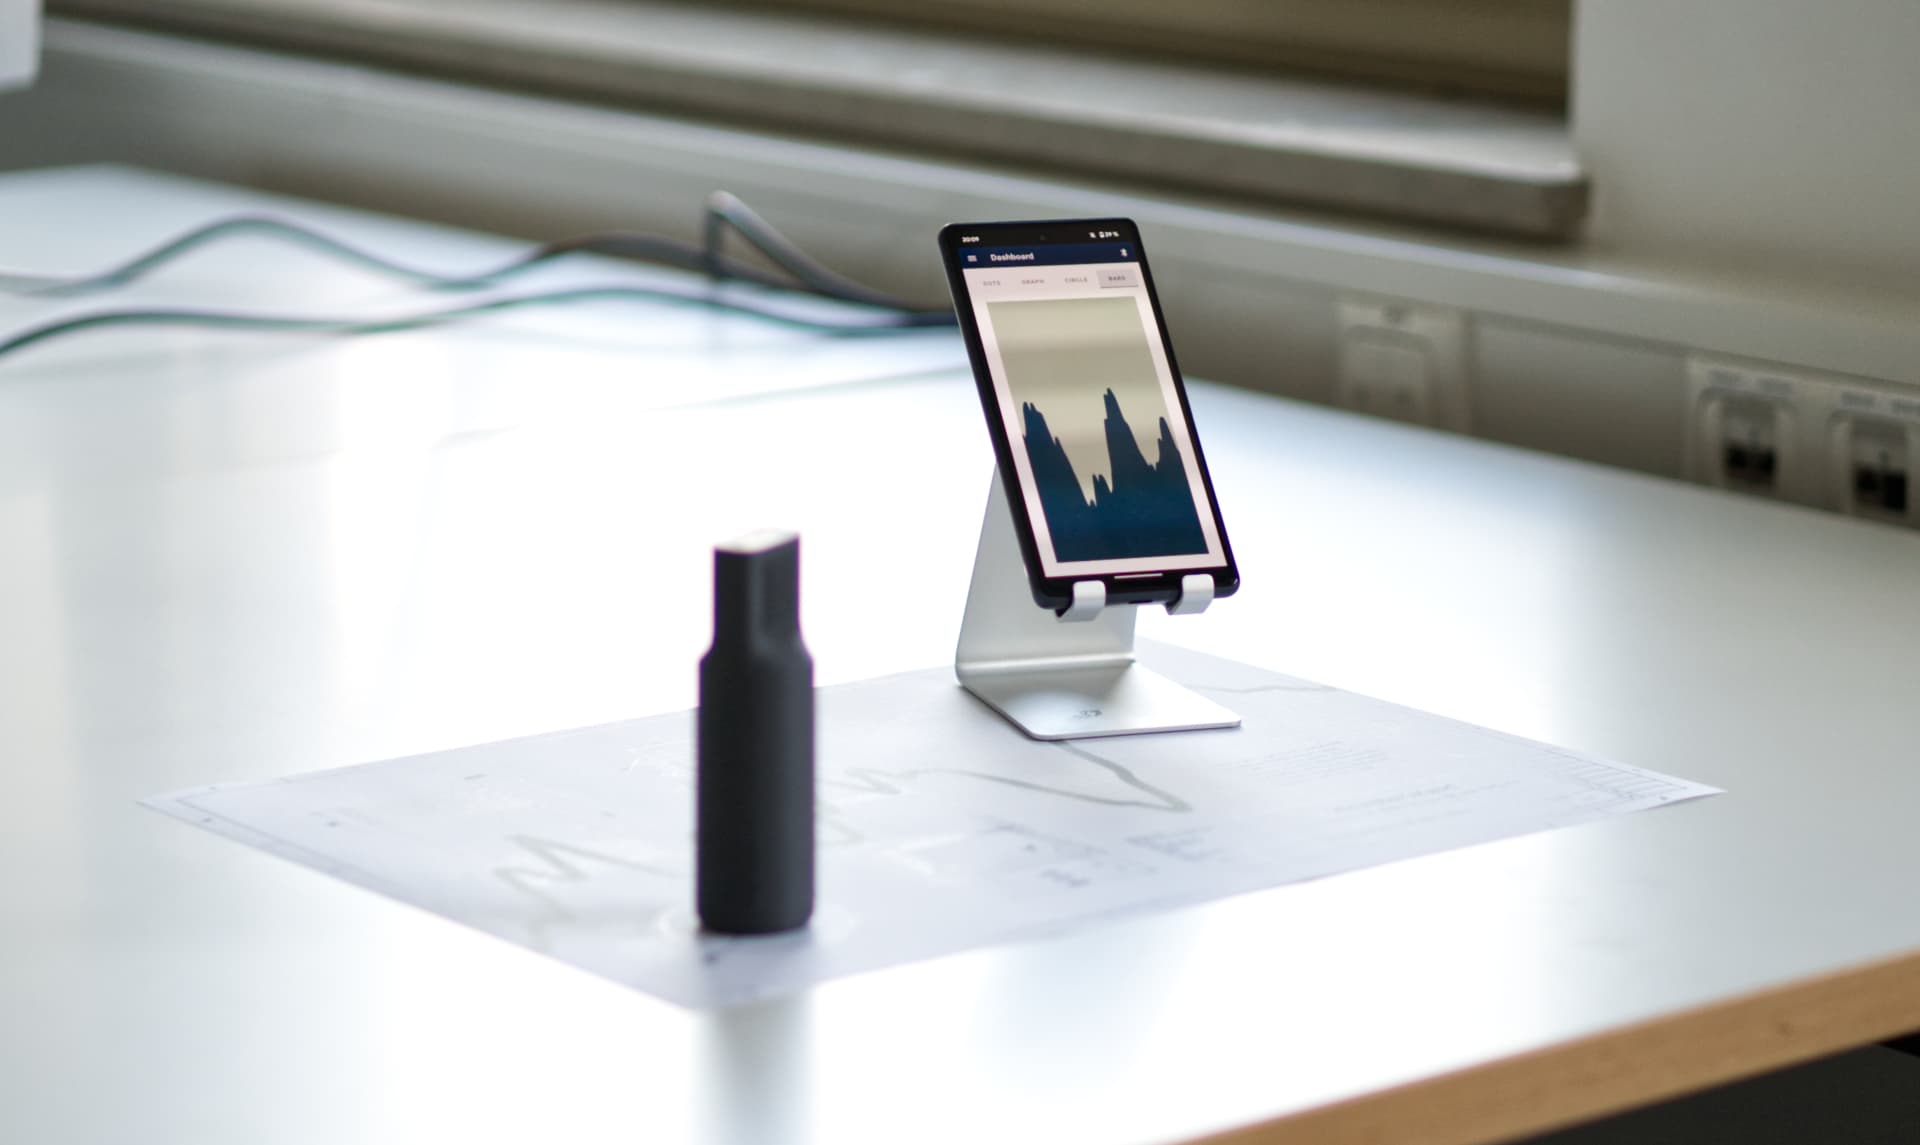
 Interactive demonstration station
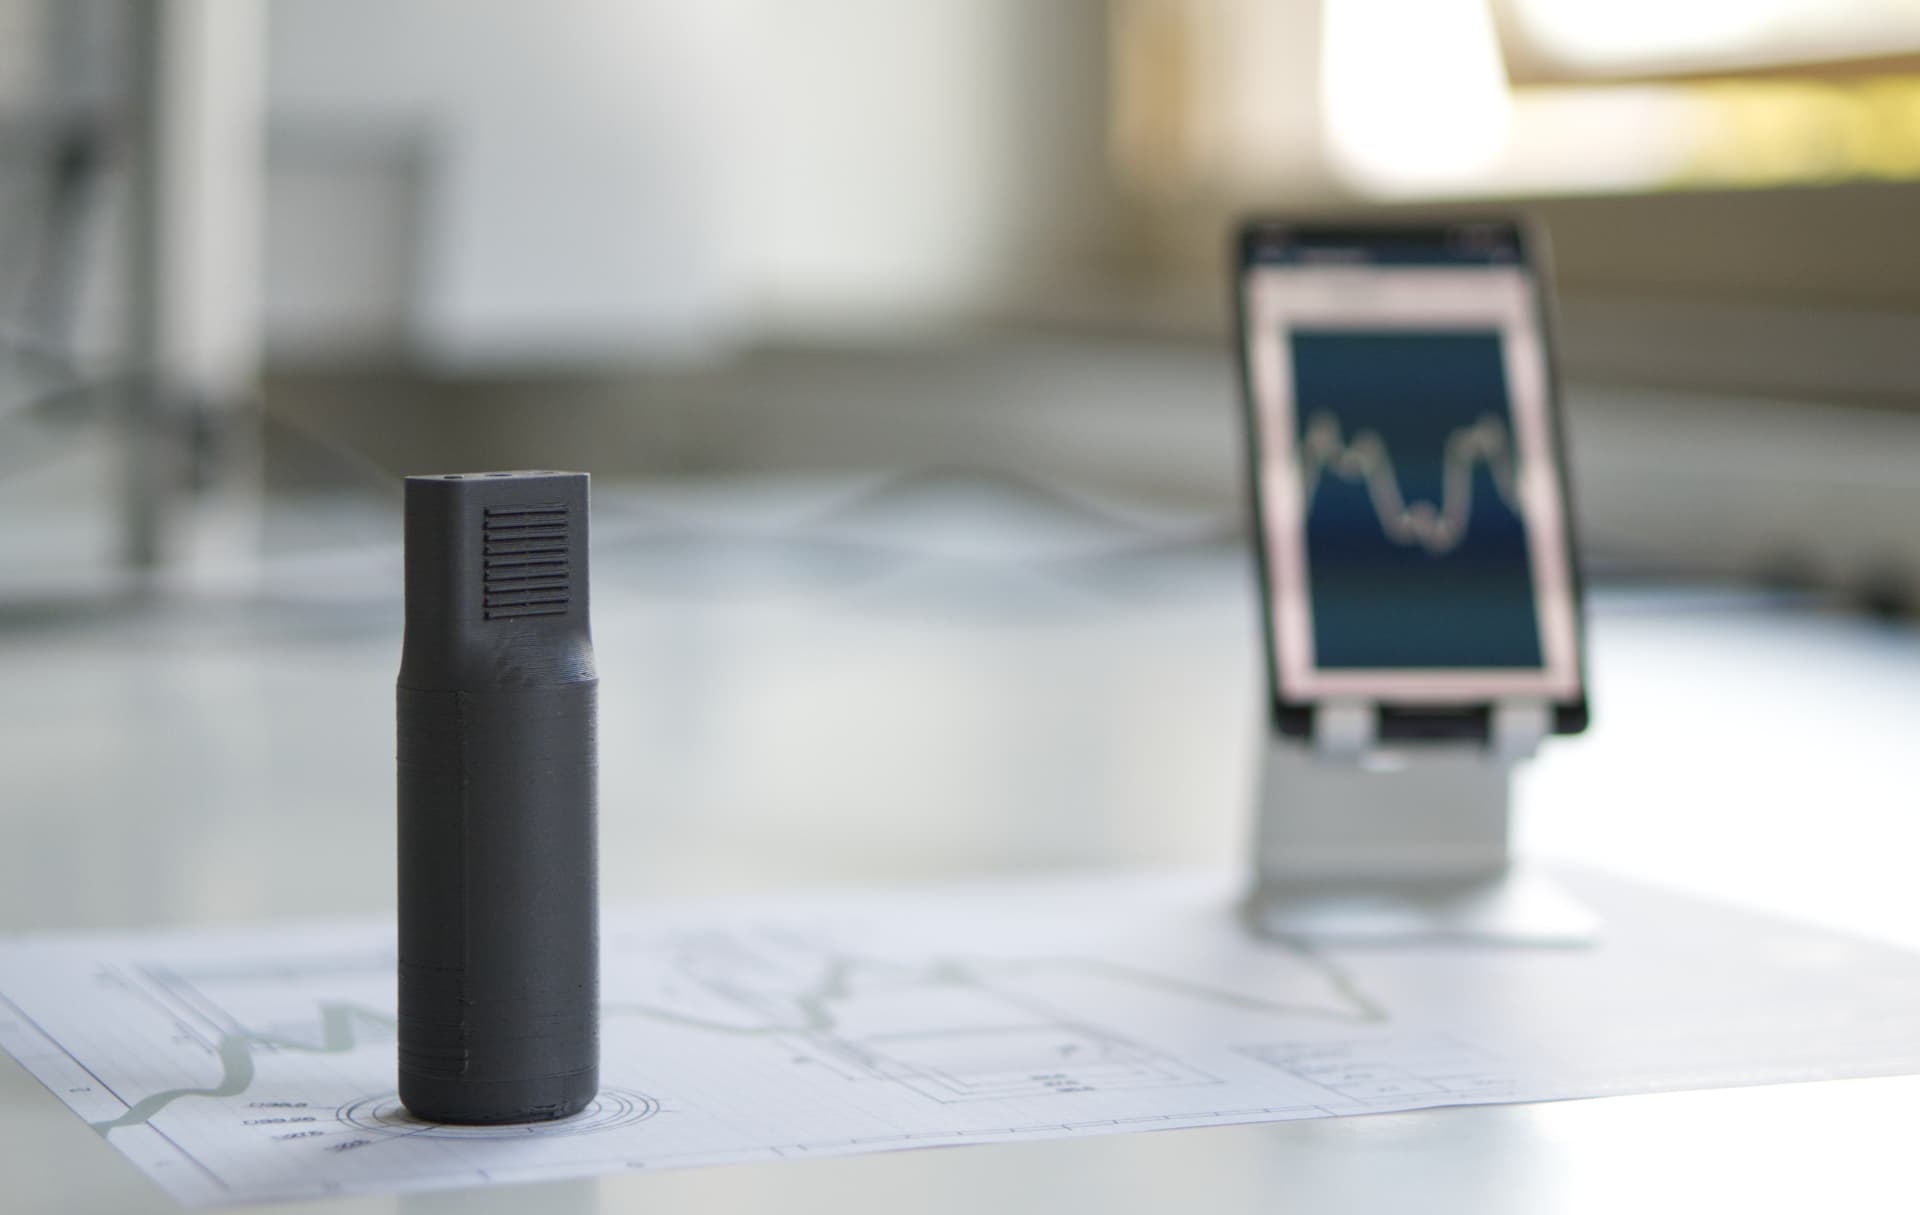
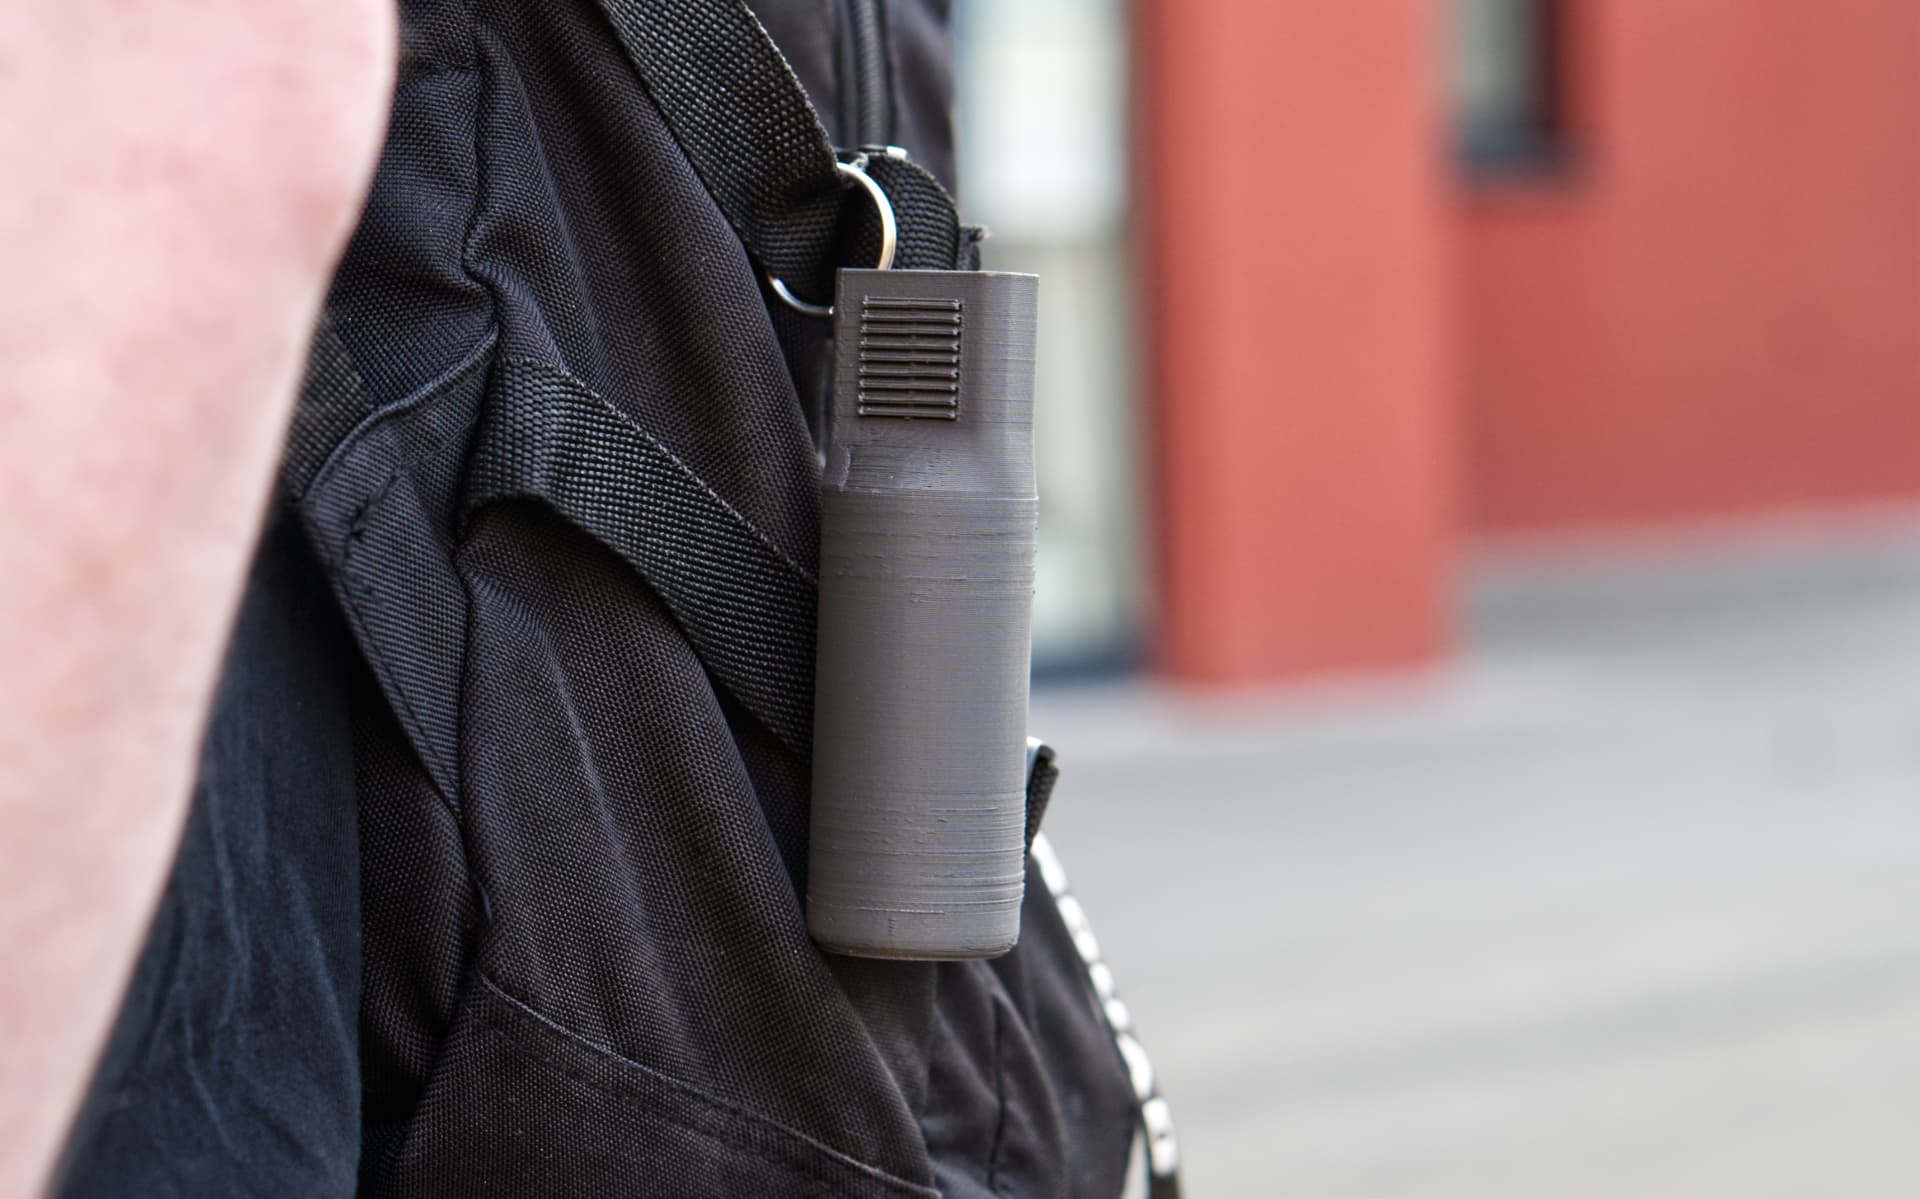
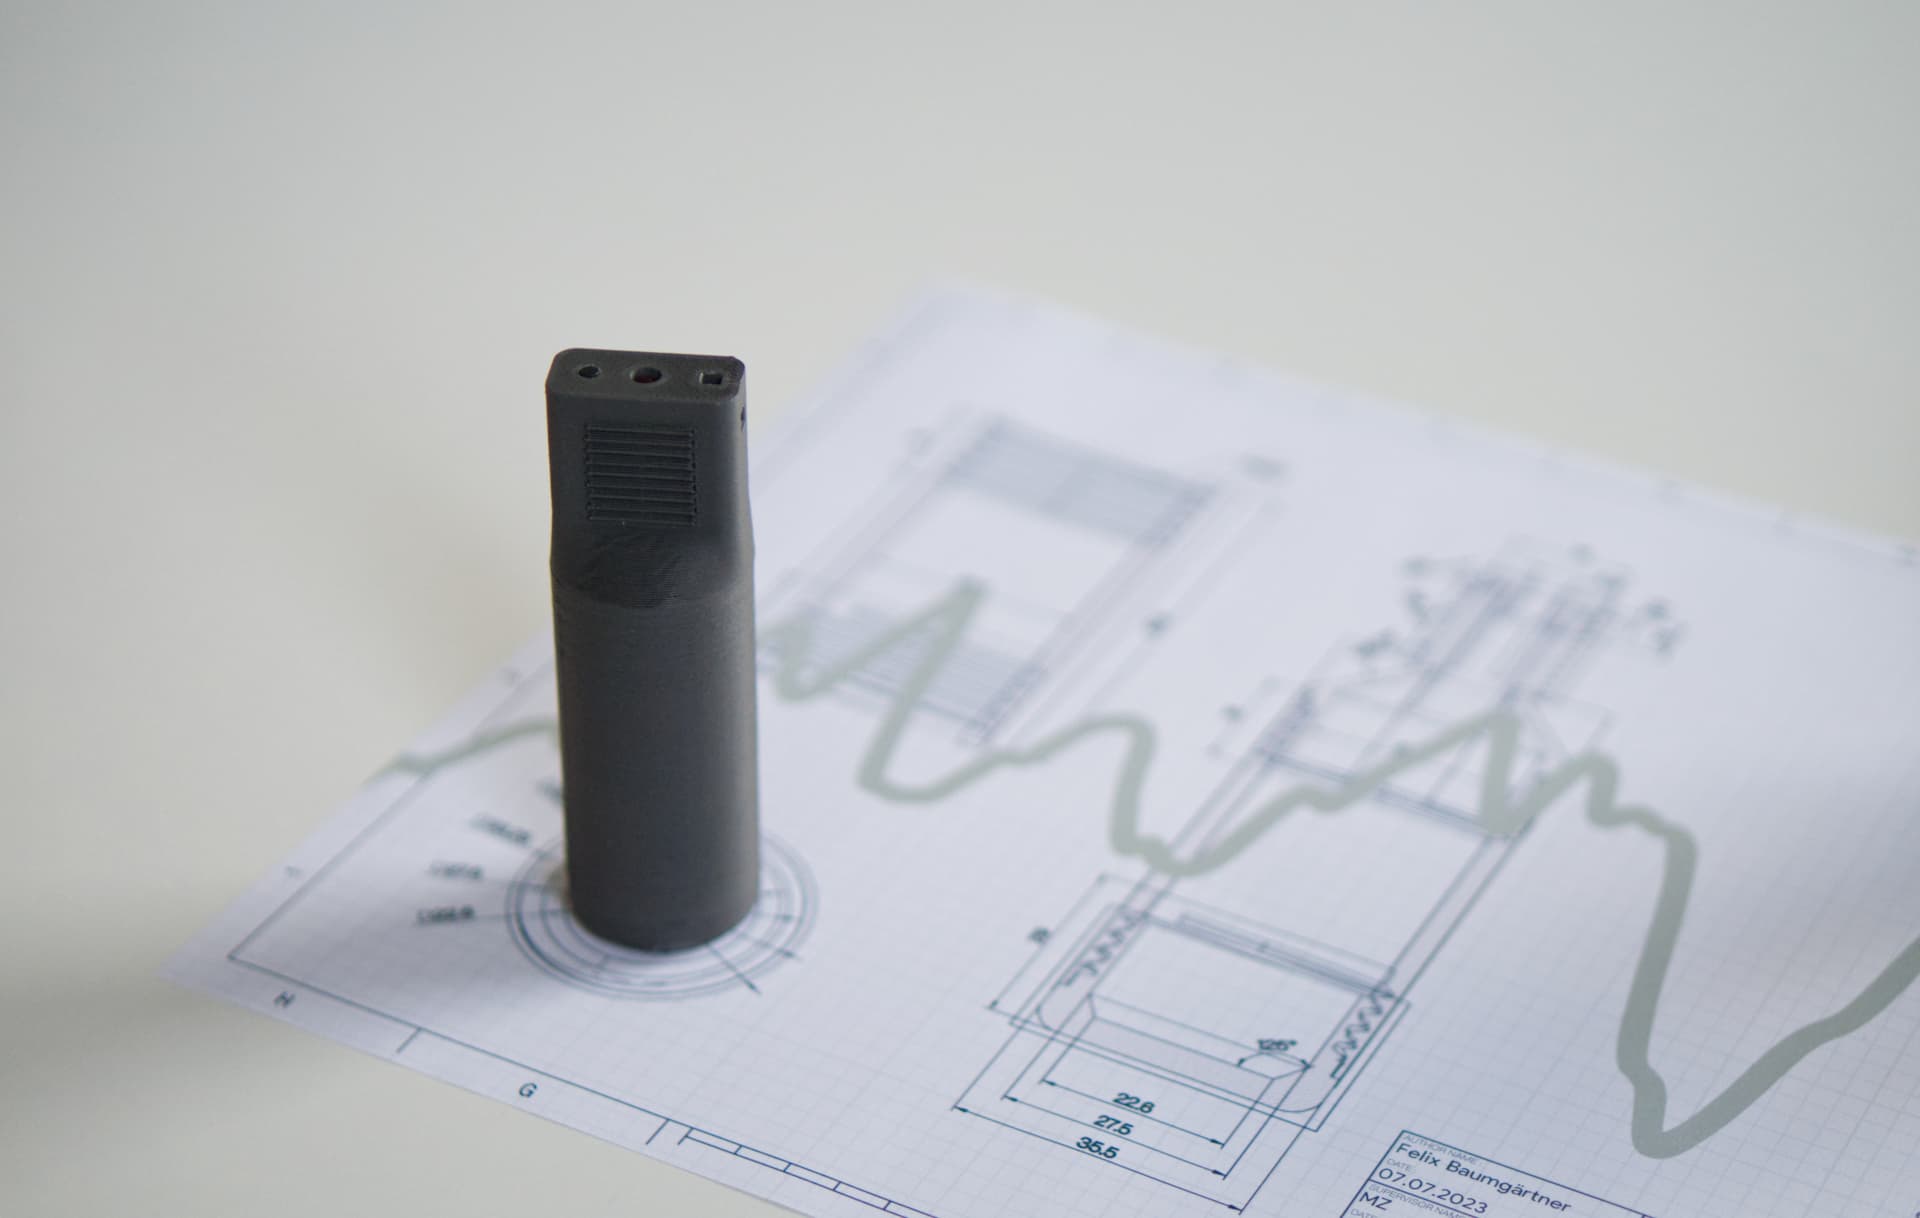 Close-up of the physical weather wand device
 Visitor interaction during the exhibition
Real-World Testing
 Field testing the weather wand in natural environments
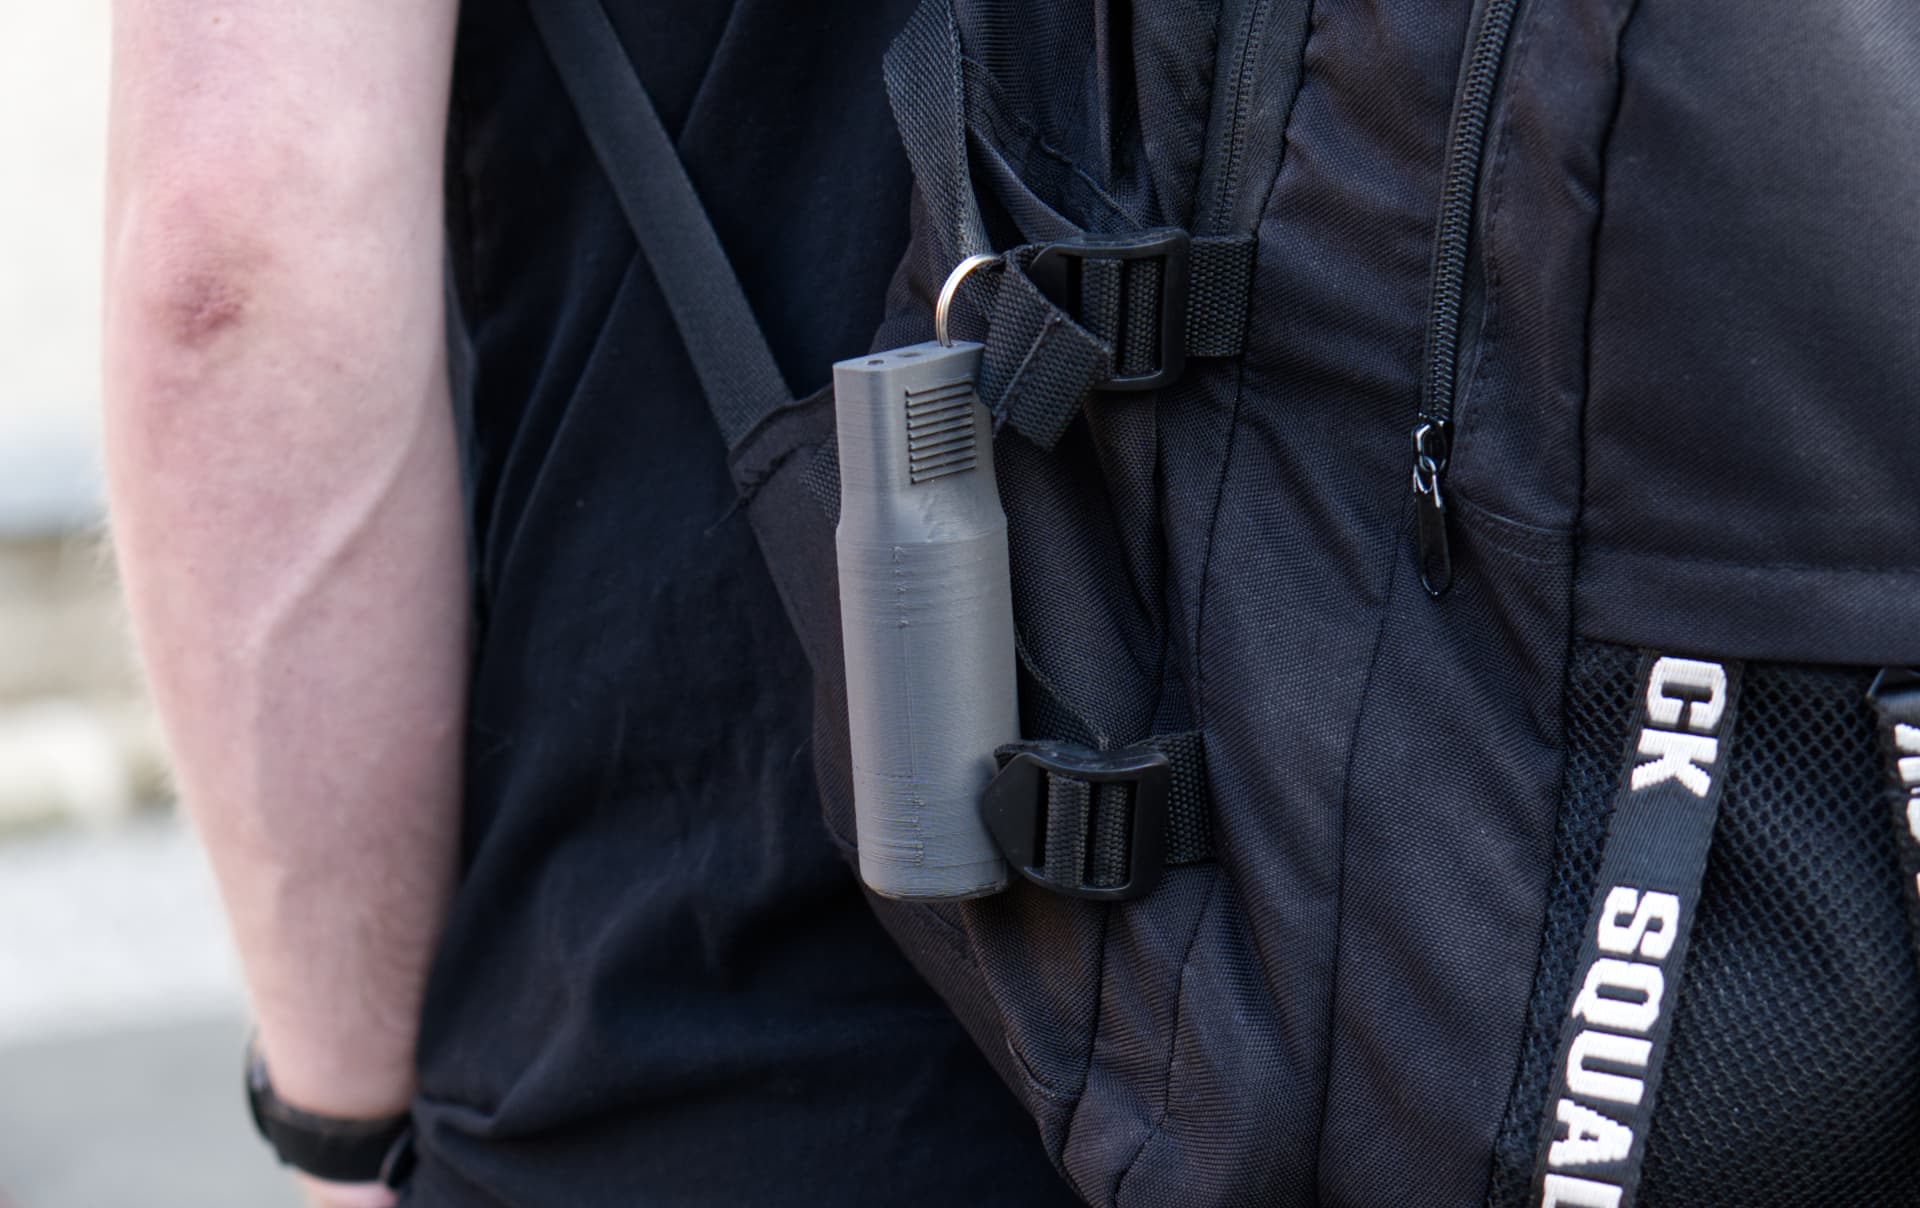 Gathering real environmental data outdoors
Key Features
- Real-time sensor data from portable weather wand
- Generative art visualizations unique to current environmental conditions
- 16-day weather forecasts from national weather service
- Weather warnings and severe weather alerts
- Radar imagery showing precipitation patterns
- Progressive Web App installable on mobile devices
- Native Android support via Capacitor
- Offline capability with PWA caching
Technical Challenges
Web Bluetooth Compatibility:
- WebBLE only functions in Google Chrome
- Chromium forks on Linux don’t support WebBLE
- Required specific browser recommendations for users
Sensor Data Reliability:
- MQTT protocol ensured stable sensor communication
- BLE provided low-power wireless connectivity
- Data validation algorithms filtered erroneous readings
Cross-Platform Deployment:
- PWA architecture enabled web and mobile support
- Capacitor compilation for native Android experience
- Responsive design adapting to various screen sizes
The Result
WeatherWand successfully demonstrates how environmental sensor data can be transformed into engaging, artistic experiences. The project combines:
- IoT hardware development with ESP32 and sensors
- Mobile app creation using modern web technologies
- Creative coding through generative art algorithms
- API integration with national weather services
- Bluetooth Low Energy (BLE) for wireless device communication
- MQTT protocol for efficient messaging
The project was version controlled using Git on a private Gitea instance, documenting the complete development process from sensor integration to generative visualization.
What I Learned
This project taught me how to bridge the physical and digital worlds through IoT technology. Working with ESP32 microcontrollers, BLE communication and MQTT protocols strengthened my embedded systems knowledge. Building the PWA with Capacitor showed me how modern web technologies can create native-quality mobile experiences.
The generative art component pushed me to think creatively about data visualization, transforming abstract environmental measurements into compelling visual narratives. Integrating with DWD Open Data demonstrated the value of combining personal sensor networks with professional meteorological services.
WeatherWand proves that environmental data doesn’t have to be boring. With the right combination of hardware, software and creative thinking, it can become a personal art installation.